
Why most restaurants on Just Eat have a perfect 5
Why 72% of restaurants are rated 5/5, but averaged only 18% would be
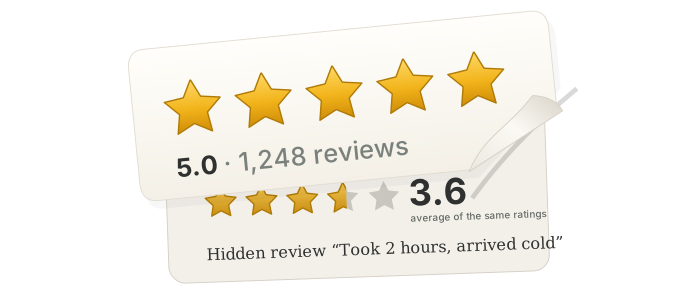
72% of active UK restaurants on Just Eat show a perfect score of 5/5. But when the same ratings are averaged, only 18% would get 5.
The competition regulator, CMA, has been investigating Just Eat’s ratings since March, so I thought I’d look into it myself.
Two things make Just Eat’s 5s look better than they are. First, how Just Eat calculates the score. Second, the number of reviews shown beside it.
Key findings
- 72%of UK restaurants show a perfect 5. Averaged, only 18% would.
- 450,000low-rated comments on 5‑star restaurants that customers can't see.
- 12recent ratings behind one 5 “out of 1,997 reviews”.
- 85/100people thought a score used most of its reviews. It used 4%.
See the restaurant data for where you live on yeet.food
72% get a perfect 5
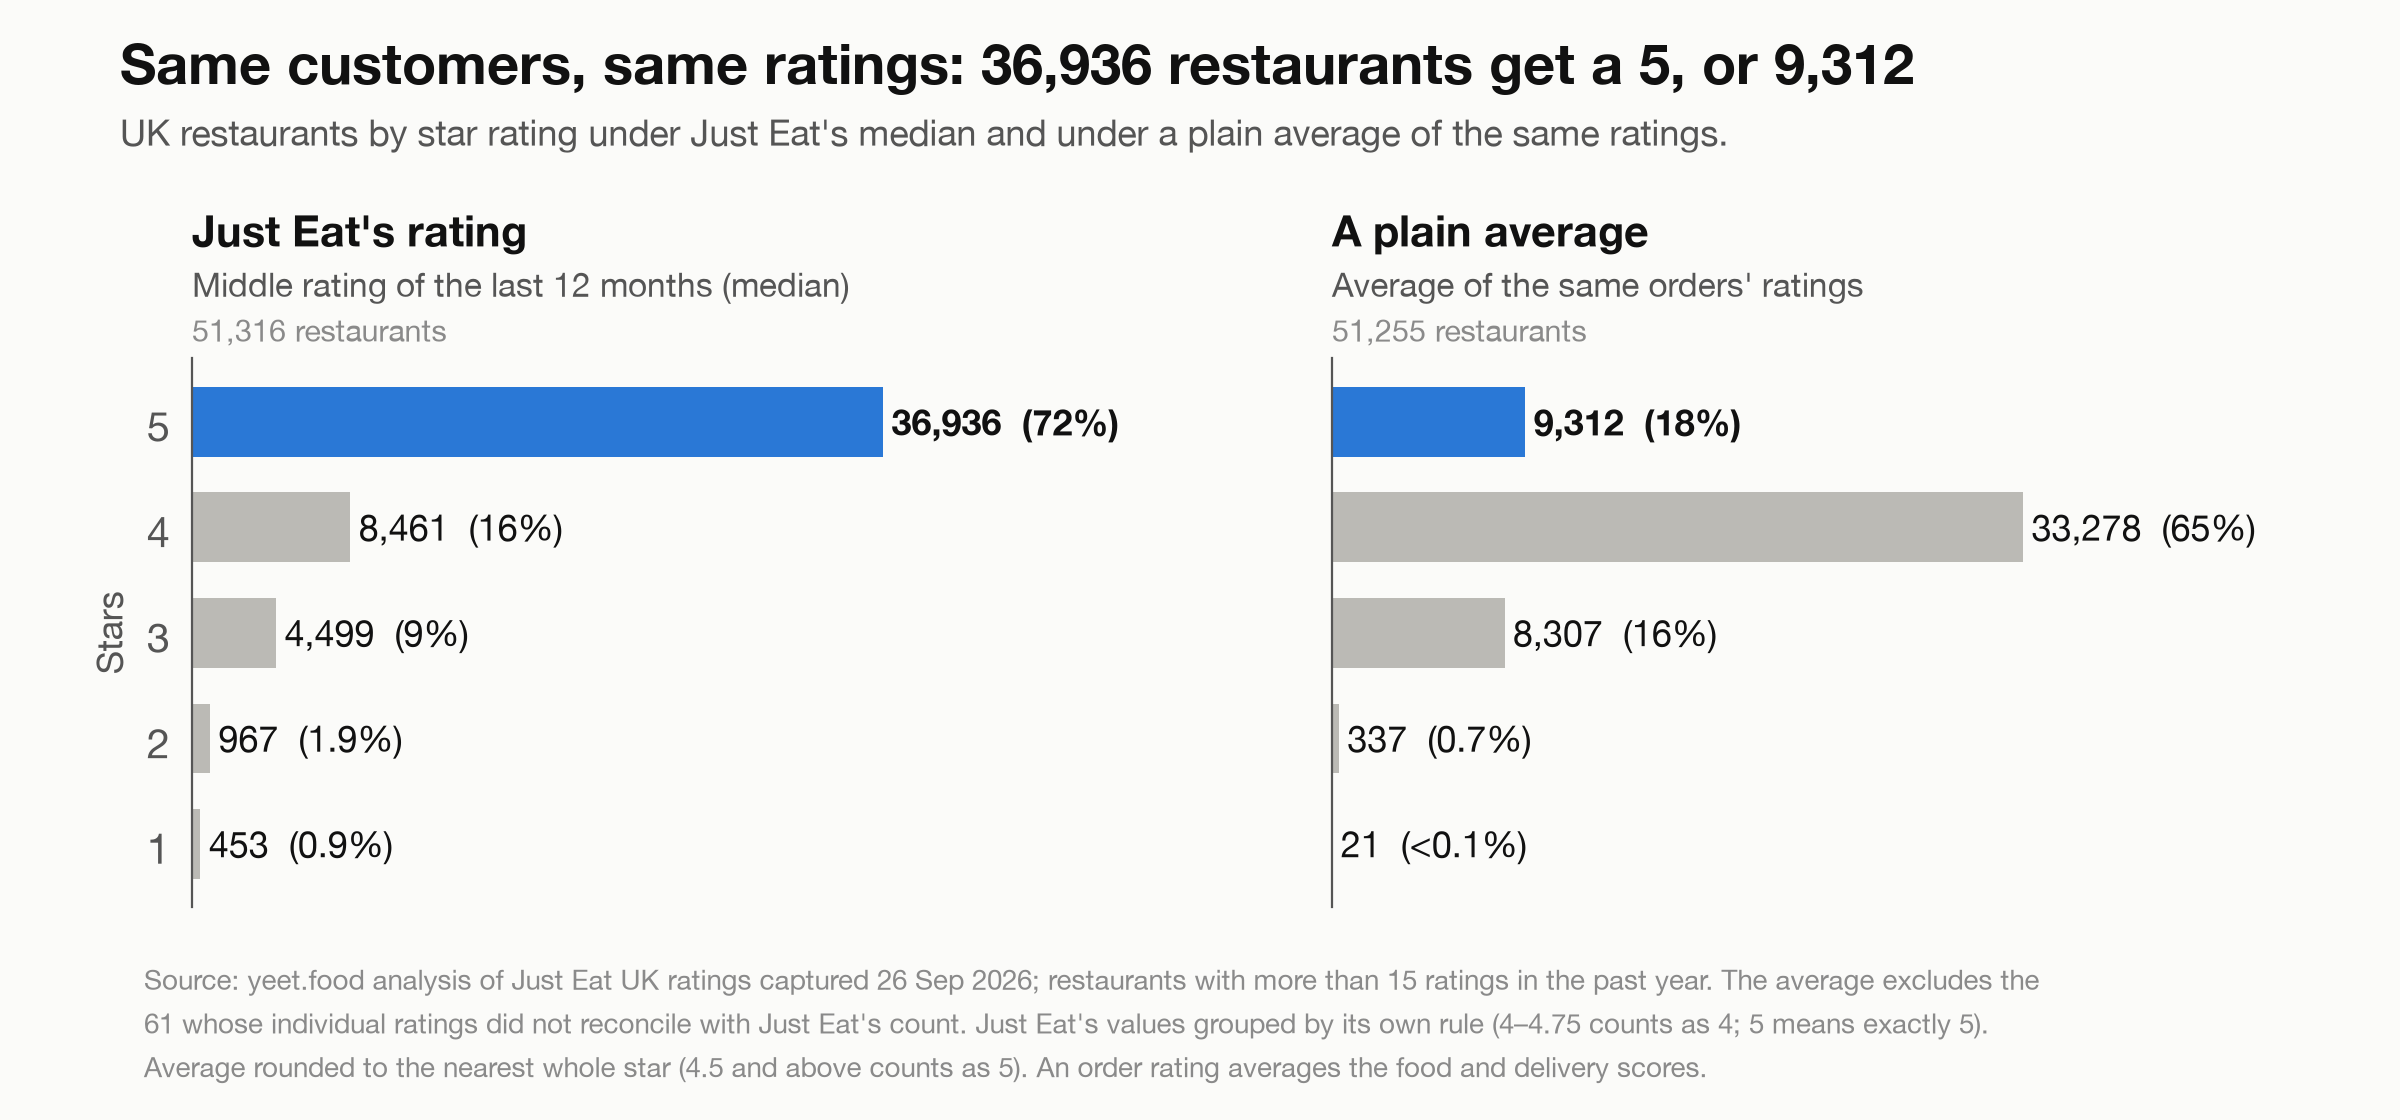
There are 51,316 UK restaurants on Just Eat with more than 15 ratings in the past year. Of those, 36,936 - 72% - have a perfect score of 5.
With an average of those same ratings only 9,312 (18%) would get a 5.
How the score works
Just Eat combines food and delivery scores into one “order rating”.
Just Eat puts the past year’s rating in order, from 1 to 5, and finds the middle value. That’s the score. The median.
Not the average. The middle.
If 51% of ratings are five stars the restaurant gets a 5, even if the remaining 49% are one star.
The middle rating (median)
5 / 5
The average (mean)
3.2 / 5
Just Eat says it uses the middle score because “it better represents the typical experience than a simple average” and “protects partners’ scores from outliers or extreme ratings”.
Most online ratings cluster at the extremes - lots of 5s, lots of 1s. 12
Just Eat is no different. Of its seven million recent ratings, 55% are five stars. Another 20% are 1 star.
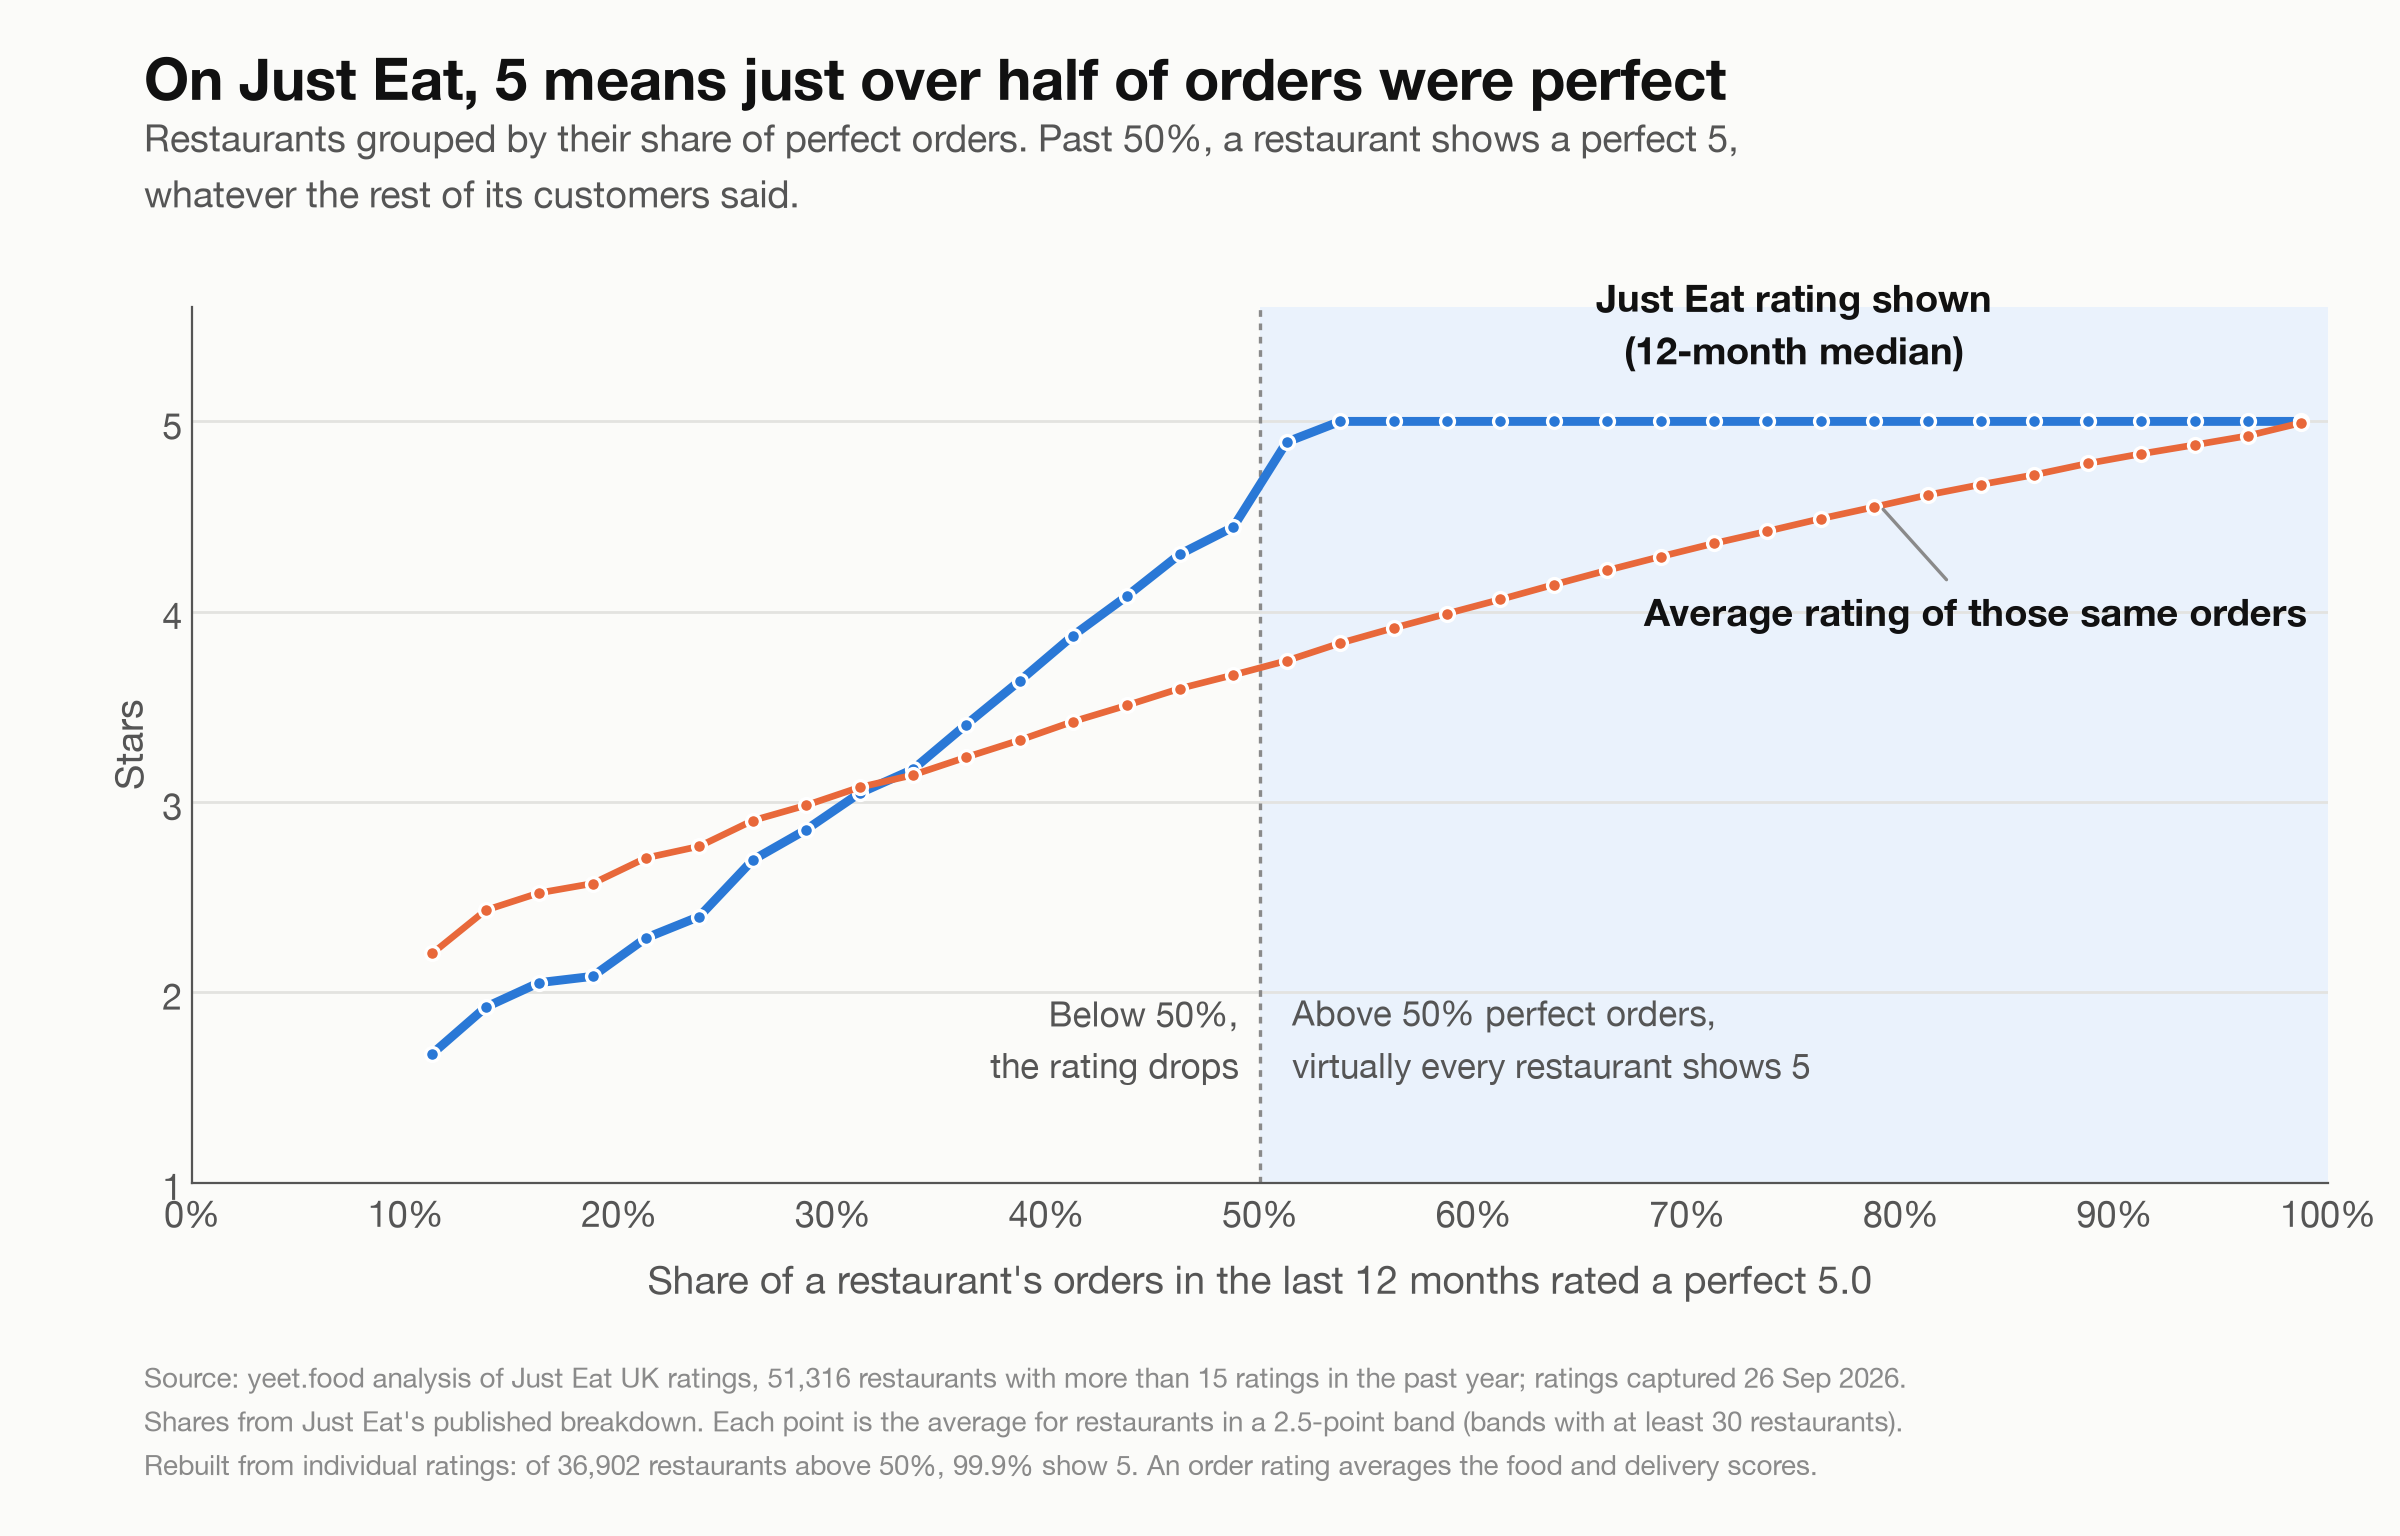 Open the full-size chart in a new tab.
See the restaurant data for where you live on yeet.food
What the 5 leaves out
Even among restaurants showing a perfect 5, roughly 11% of their ratings were 1 star.
At some ‘5-star’ restaurant, more than 20% of ratings is just 1-star. And you can’t see the review text to know why.
About half of all ratings come with a written comment, but Just Eat shows these to the restaurant, not to other customers. In the past year, 5-star restaurants received more than 450,000 written comments with ratings below three stars.
And these are only the customers who rated. Research on eBay found that buyers with a bad experience were more likely to do nothing than to leave negative feedback, so public ratings overstated how happy people were.3
The number beside the score
So the score itself flatters most restaurants. The number printed next to it does too.
Just Eat’s help page says: “we now display the number of ratings it is based on and a breakdown of how those ratings are distributed.”
This Cambridge sushi restaurant shows a 5 “out of 1,997 reviews”. But its score and breakdown use just 12 recent ratings, not the 1,997 displayed.
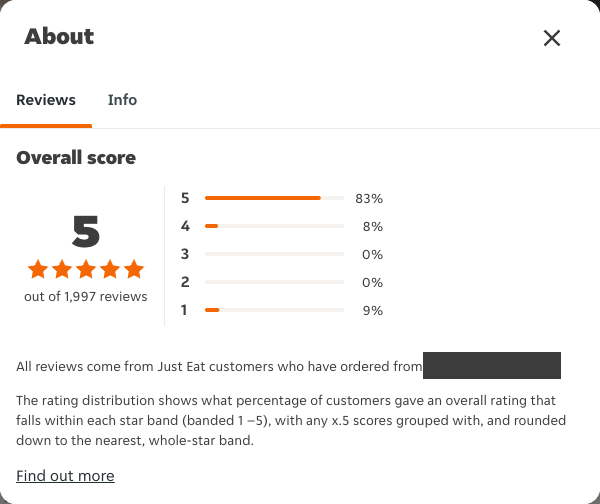
Just Eat’s reviews panel for a restaurant in Cambridge. Captured 27 September 2026, 18:28.
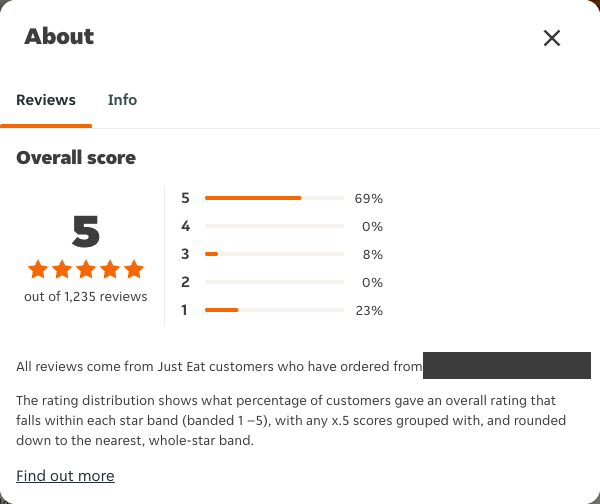
A score of 5 “out of 1,235 reviews”, which is actually from 13 ratings, with 23% of them in the lowest band. Captured 29 September 2026, 07:49.
For three in four listings, the number shown is larger than the number the score uses.
Only 7 million of the 39.5 million reviews shown beside the scores are used to calculate them - fewer than one in five.
The panel itself doesn’t mention the 12-month window or the median. Both are only explained on the help page, behind a “Find out more” link.
See the restaurant data for where you live on yeet.food
What people think the number means
I showed 100 UK adults on a survey site a real Just Eat listing, with the restaurant and app names hidden. Of them, 93 had used a delivery app in the past year.
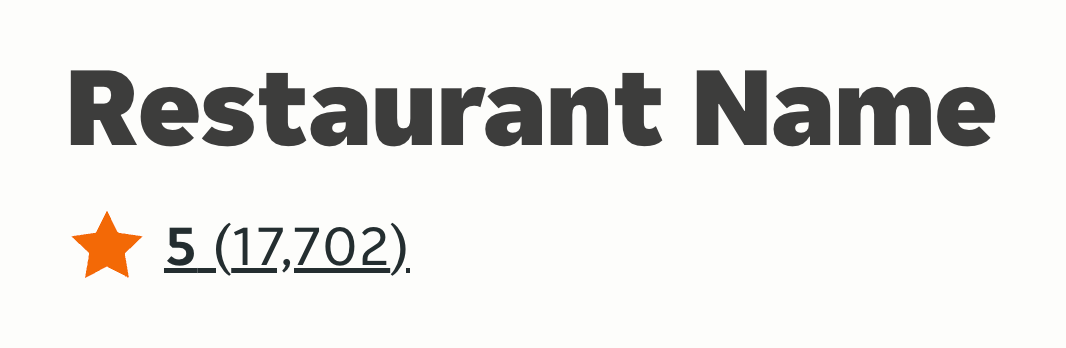
85 thought this score used all or most of the 17,702 reviews. It used 760 – just 4%.
Next, I showed the rating breakdown without the score.
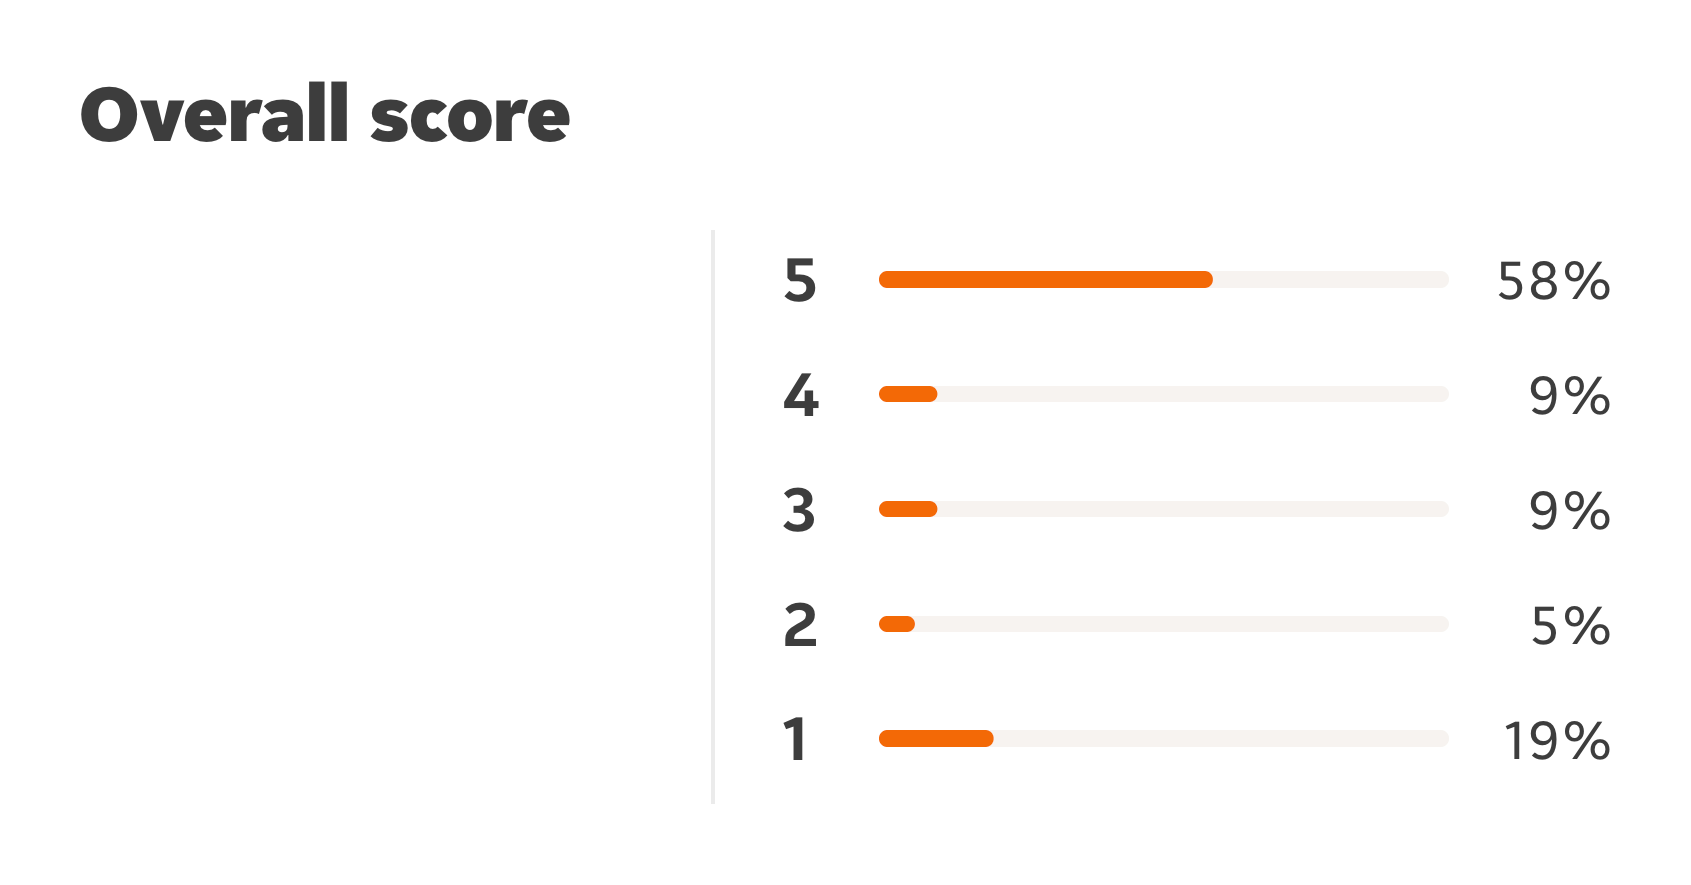
Only 18 of the 100 expected a 5-star rating. Half said 4, which is what a plain average of those ratings gives. Almost a third said 3.
When I told them how the 5 was actually calculated 64% said the rating was misleading or wrong. “I feel lied to,” one wrote. “I didn’t realise ratings worked that way,” and “It’s a false rating and doesn’t reflect the true rating at all” said others.
Why it matters
That inflated score doesn’t just flatter restaurants - it decides what you see.
Just Eat says ratings “influence its ranking in our search results”. It’s possible for a 5-star restaurant with 12 recent ratings to outrank a 4.5-star place with 500.
Research on other platforms shows how much displayed ratings move customers. On Yelp, an extra half-star made restaurants sell out 49% more often.4
When one restaurant platform changed how it displayed ratings in a way that inflated them, customers tried fewer new restaurants and orders shifted towards those that were already popular.5
These studies concern other platforms, but show why the way ratings are displayed matters.
The regulator
In March 2026 the Competition and Markets Authority (CMA) opened an investigation into “whether Just Eat’s ratings system has inflated certain restaurants’ and grocers’ star ratings – giving consumers a potentially misleading picture of quality”.
The CMA says no finding has been made and it shouldn’t be assumed Just Eat has broken the law. Its next update is expected in winter 2026–27.
The CMA’s guidance on reviews counts ratings and review counts as review information that must be correct, and says leaving out important information, or making it hard to see, can make it misleading.6 Whether Just Eat’s display does that is for the CMA to decide.
I’ve shared the summary figures, analysis, and survey findings with them.
Just Eat’s response
I sent Just Eat these findings on Sep 30th and gave them 5 days to respond. They’ve yet to reply.
See the restaurant data for where you live on yeet.food
Is the median wrong?
Not in itself. It can limit the effect of a handful of very low ratings, and the 12-month window means a place that gets a new owner or improves isn’t stuck with its old score. It cuts both ways, too: for restaurants averaging below three stars, the median usually gives a lower score than the average.
The question is what customers see. A single 5 beside a big number suggests that nearly all those customers loved it.
For most restaurants, that isn’t what the data says.
The CMA’s investigation is expected to report this winter. Until then, that 5-star badge might mean less than you think.
What would help
Deliveroo says the rating on its restaurant list “is an average of the last 400 ratings”. Just Eat could:
- show the number of ratings the score is based on, as its help page says it does;
- show the share of low ratings beside the score, not behind a click;
- use an average, or show both;
- count the customers who stay silent: researchers found eBay buyers did better when sellers were judged on positive feedback as a share of all their sales, not just the ones that got rated.7 Only Just Eat knows how many orders go unrated.
Platforms can also make honest ratings easier to give. When Airbnb hid each review until both sides had submitted theirs, retaliation fell and ratings became more candid.8
What about where you live?
Check your area
Across the UK, 72% of takeaways with more than 15 recent ratings show a perfect 5 on Just Eat. With a plain average of the same ratings, 18% would. Enter your postcode to see your area.
Takeaways with more than 15 ratings in the 12 months to 26 September 2026. yeet.food is independent and not affiliated with Just Eat.
Every rated Just Eat restaurant in the UK, with its share of low ratings and how many ratings its score is really based on, is on yeet.food. It’s my independent site and isn’t affiliated with Just Eat.
How I did it
In September 2026 I collected Just Eat’s published rating summaries for 86,717 UK listings. Figures here use the snapshot taken on 26 September 2026. They cover the 70,941 listings that were trading: I left out listings that were offline and hadn’t been rated for six months.
I recalculated each restaurant’s 12-month median and compared it with Just Eat’s score. It matched for 99.9% of 5-star restaurants, and for 99.1% of restaurants overall. The headline figures cover restaurants with more than 15 ratings in the past year. The “plain average” is the mean of the same order ratings, rounded to the nearest whole star, with 4.5 counting as 5; it covers the 51,255 restaurants whose rating totals matched Just Eat’s published count.
The survey ran on Prolific on 30 September 2026.
See the restaurant data for where you live on yeet.food
Footnotes
-
Hu, Pavlou & Zhang, “Overcoming the J-shaped distribution of product reviews”, Communications of the ACM, 2009. ↩
-
Schoenmueller, Netzer & Stahl, “The Polarity of Online Reviews: Prevalence, Drivers and Implications”, Journal of Marketing Research, 2020. More than 280 million reviews across 25 platforms. ↩
-
Dellarocas & Wood, “The Sound of Silence in Online Feedback”, Management Science, 2008. ↩
-
Anderson & Magruder, “Learning from the Crowd”, The Economic Journal, 2012. ↩
-
Aziz, Li & Telang, “The Consequences of Rating Inflation on Platforms”, Information Systems Research, 2023. ↩
-
CMA, “Fake reviews guidance (CMA208)”, April 2025, paragraphs 2.11 and 4.2. ↩
-
Nosko & Tadelis, “The Limits of Reputation in Platform Markets”, NBER Working Paper 20830, 2015. ↩
-
Fradkin, Grewal & Holtz, “Reciprocity and Unveiling in Two-Sided Reputation Systems: Evidence from an Experiment on Airbnb”, Marketing Science, 2021. ↩